Helpful Pictures for the Project
Some pictures which might be of some aid.
Here is the project statement.
First are annoying animated drawings
which run forever and will suck up all of your available cpu cycles
so they are not directly on this page. The animated gif is huge
(4 MB), but should work in all browsers. The other is a flash
animation which is much smaller (4 KB) but if your browser is
old, it might require a plugin. After the class was over, a 3rd
format, SVG was added (3 KB). Adobe has a
free SVG plugin.
Maple hint: Maple does not have a planecurve analog to spacecurve,
instead there is a variation on the plot command which will plot
the parametric equations x=f(t), y=g(t). For example
> f:=cos(t);g:=sin(t);
> plot([f, g, t=Pi/4..7*Pi/4],x=-1..1);
will plot a circular arc starting at 45 degrees and going around to
-45 degrees.
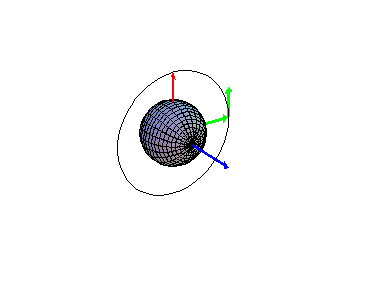
Although these images are for the Juliet problems the first image is
more general. We show a planet and a moon's orbit. The north pole
is blue and is perpendicular to the moon's orbit. Note that the
moon is going counter-clockwise as we view the orbit from the North.
For the Juliet-Uranus problem the North pole of Uranus is always
in the xy-plane, the red arrow is always in the positive z-direction
and the green arrow coming out of Uranus is also in the xy-plane.

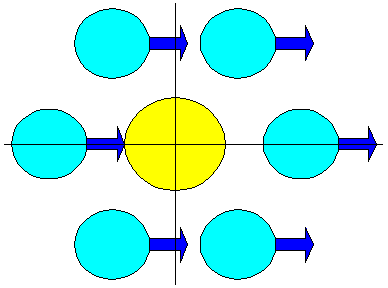
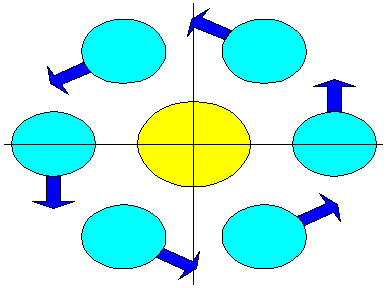
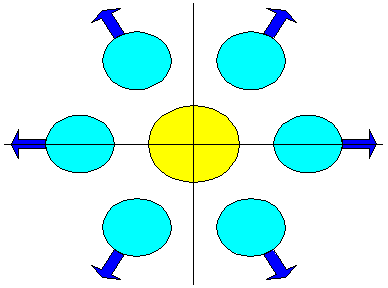
The three models for how the North pole moves as Uranus orbits the
sun.
The first keeps the North pole always pointed in the same direction.

The next is Run Howbackward's toral system.

The next is Kevin Brocolli's south is towards the Sun system.


