This poster was presented during the annual FSU Day at the Capitol. This
is a day where Florida State University showcases information and some of
its research to the general public. It was held at the State Capital Building
in Tallahassee, Florida on April 6, 1999.
| |
| |
Introduction
- the human brain is a highly convoluted surface
- considerable anatomical variablility between individuals
- use magnetic resonance (MR) images to display anatomical information
(see Figure 1)
- new methods are required to view and analyze brain data to
provide:
- improved approaches for understanding functional and anatomical
brain information
- alternate ways of visualizing and comparing individual
differences in cortical organization between subjects
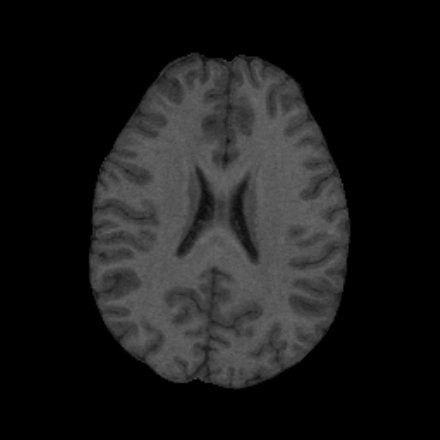
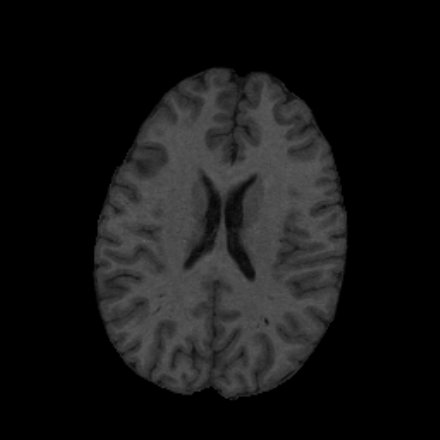 Figure 1: MR image scans from two different subjects
illustrate the variability in anatomical structure between individuals.
Figure 1: MR image scans from two different subjects
illustrate the variability in anatomical structure between individuals.
|
|
| |
|
| |
| |
Our Approach
- use mathematical theory to create a flat map of the brain
- it is impossible to flatten a curved surface in 3D space without
linear and areal distortion
- the Riemann Mapping Theorem (1850's) says it is possible to
preserve conformal (angular) information
- our approach attempts to preserve the conformal structure between
the original cortical surface and the flattened surface
|
|
| |
|
| |
| |
Flattening the Human
Cerebellum
|
|
| |
|
| |
| |
Figure 2: The human cerebellum is
colored according to the following cortical regions: forest green = lobulus
seminlunaris, lobulus semilunaris inferior, lobulus biventer; red = tonsils,
flocculus; yellow = lingula, lobulus centralis, lobulus quadrangularis; blue =
lobulus simplex, lobulus semilunaris superior; grey = white matter;
bright green = fissura prima; cyan = fissure secunda; magenta = fissura
horizontalis; purple = boundary used for flat maps.
|
|
| |
|
| |
| |
Figure 3: The surface representing
the cerebellum is exctracted from the MR images and rendered to show a view
from the front and back.
|
|
| |
|
| |
| |
Figure 4: Flattened map of the
cerebellum (in the Euclidean plane). Colors correspnds to regions shown in
in Figure 2.
|
|
| |
|
| |
| |
Figure 5: Cerebellum mapped to a disk
(in the hyperbolic plane). The origin (map focus) is marked in black in the
center of the maps.
|
|
| |
|
| |
| |
Figure 6: Cerebellum mapped to a
sphere. Two different views are shown.
|
|
| |
|
| |
| |
Advantages and Benefits
- conformal mappings are canonical and hence mathematically unique
- easy to impose a coordinate system, which allows comparison of
different maps
- easy to transform and change locations of map distortion
- clinical tool for analyzing anatomical and functional differences
|
|
| |
|
| |
| |
For more information, please contact:
Dr. Monica K. Hurdal, Department of Mathematics, Florida State
University, 32306-4510
Phone: (850) 644-7378; Email: mhurdal@math.fsu.edu
This work has been carried out in collaboration with Dr. Ken Stephenson,
University of Tennessee, Knoxville and the International Neuroimaging
Consortium (see http://pet.med.va.gov:8080/hbp.html). This work has been
supported in part by NIH grant MH57180.
|
|
| |
|