Statistical Graphs, Charts, Tables, Percentages, Percentile
EXAMPLE 2.8.1
The bar graph below shows the results of a survey in which a number of dogs were asked "What is your favorite food?" No dog gave multiple answers.
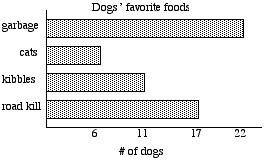
The image shows a bar graph, conveying the following information.
22 dogs said that their favorite food was "garbage."
6 dogs said that their favorite food was "cats."
11 dogs said that their favorite food was "kibble."
17 dogs said that their favorite food was "road kill."
What percent of dogs said that their favorite food was cats?
A. 6%
B. 17%
C. 11%
D. 30%
EXAMPLE 2.8.1 SOLUTION
First, we find the number of dogs who responded to the survey.
We do this by recognizing that the numbers on the horizontal
axis tell how many dogs gave each of the four responses.
If we add those four numbers, we have the total number of dogs who responded:
6 + 11 + 17 + 22 = 56
There were 56 dogs who responded to the survey
(we say that in this survey the sample size or sample population is 56,
or simply that n = 56).
Now we read the graph and see that 6 of the 56 dogs gave the response "cats."
Thus, we need to find the percentage that corresponds to "6 out of 56."
To do this, we divide 6 by 56, and then multiply by 100%.
The best choice is C.
Notice that when we "multiply 0.107 by 100%" what we actually do is
move the decimal point two places to the right, and append a "%" sign.
FACT: To convert a decimal number to a percent, we move the decimal point two
positions to the right, and add a percentage sign.
EXAMPLE 2.8.2
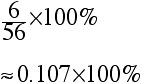
The graph below shows the distribution according to academic major of a group of students.
None of them have double majors.
The image is a pie chart showing the following:
60 students major in business.
12 students major in music.
80 students major in humanities.
35 students major in social science.
25 students major in "other."
Approximately what percent are majoring in something other than music?
A. 25%
B. 12%
C. 88%
D. 94%
see solution
EXAMPLE 2.8.3
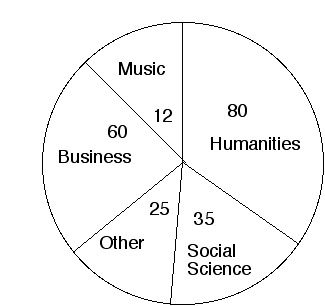
The graph below shows the percentage distribution of grades on an exam.
Assuming that 828 people took the test, how many received
grades of A or B?
The image is a bar graph showing the following:
10% of students received an F.
7% of students received a D.
37% of students received a C.
25% of students received a B.
21% of students received an A.
see solution
Percent increase or percent decrease
If a quantity increases or decreases, we can compute the percent increase or percent decrease.
Percent increase
If a quantity is increasing, we compute percent increase as follows:
Percent increase = [(amount of increase) divided by (beginning amount)] times 100%
Which is the same as:
Percent increase = [(ending amount minus beginning amount) divided by (beginning amount)] times 100%
Percent decrease
If quantity is decreasing, we compute percent decrease as follows:
Percent decrease = [(amount of decrease) divided by (beginning amount)] times 100%
Which is the same as:
Percent increase = [(beginning amount minus ending amount) divided by (beginning amount)] times 100%
EXAMPLE 2.8.10
In July, Gomer had 12 pet wolverines and 10 fingers. In August, he had 15 pet wolverines and 8 fingers.
1. Find the percent increase in his wolverines.
A. 25%
B. 125%
C. 30%
D. 3%
2. Find the percent decrease in his fingers.
A. 80%
B. 180%
C. 20%
D. 120%
SOLUTIONS:
1. He started with 12 wolverines and ended with 15 wolverines, so the number of wolverines increased by 3.
Percent increase = [(amount of increase) divided by (beginning amount)] times 100%
= (3 divided by 12) times 100%
= .25 times 100%
= 25%
2. He started with 10 fingers and ended with 8 fingers, so the number of fingers decreased by 2.
Percent decrease = [(amount of decrease) divided by (beginning amount)] times 100%
= (2 divided by 10) times 100%
= .2 times 100%
= 20%
EXAMPLE 2.8.11
(The information in this example is factual, according to the Workers Rights Council.)
1. In a sweatshop in El Salvador, a seamstress is paid 74 cents;
for the labor required to sew one Liz Claiborne jacket (retail price: $198).
If she were to be paid a "living wage," her pay would for that job would increase to $2.64.
Find the percent increase in her pay if this were to happen.
2. Referring to the information in Part 1:
Suppose that the seamstress' pay is increased so that she receives a "living wage," and
suppose that the entire cost of this is passed on to the consumer.
Find the percent increase in the retail cost of the jacket.
see solution
SOLUTIONS
1. If her pay imcreased from 74 cents to $2.64 then
Percent increase = [(ending amount minus beginning amount) divided by (beginning amount)] times 100%
= [(2.64 minus .74) divided by (.74)] times 100%
= (1.90 divided by .74) times 100%
= 2.57 times 100%
= 257%
2. The $1.90 increase in pay is added to the $198 price of the jacket, then the percent increase
in the price of the jacket is:
(1.90 divided by 198) times 100%
= .0096 times 100%
= .96&, or slightly less than 1%.
In other words, a 1% increase in the price of the jacket will fund a 257% increase in the seamstress' pay.
EXAMPLE 2.8.12
Click here for a literary exploration involving percent increase.
PERCENTILE RANK
The percentile rank of a value in a distribution tells the
percent of scores that were less than the given value.
EXAMPLE 2.8.13
The information below refers to scores on a standardized exam.
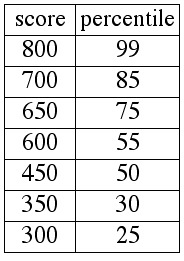 The image is a table conveying the following information :
A score of 800 has a percentile rank of 99.
A score of 700 has a percentile rank of 85.
A score of 650 has a percentile rank of 75.
A score of 600 has a percentile rank of 55.
A score of 450 has a percentile rank of 50.
A score of 350 has a percentile rank of 30.
A score of 300 has a percentile rank of 25.
1. What percent of test-takers had scores that were less than 350?
2. What percent of test-takers had scores that were greater than or equal to 600?
3. Approximately what percent of test-takers had scores that were between 700 and 450?
EXAMPLE 2.8.13 SOLUTIONS
We must answer all three questions by referring to the definition of percentile rank
given above.
1. Since a score of 350 has a percentile rank of 30, the table tells us
directly that 30% of the test-takers had scores less than 350.
2. Since a score of 600 has a percentile rank of 55, the table
tells us directly that 55% of the test-takers had scores less than 600;
this means that the other 45% of test takers had scores greater than or equal
to 600 (because 100% minus 55% = 45%).
3. Since a score of 700 has a percentile rank of 85, the table tells
us directly that 85% of the test-takers had scores less than 700; likewise,
the table tells us directly that 50% of the test takers had scores less than 450.
Now we subtract: 85% minus 50% = 35%. Roughly 35% of the test-takers
had scores between 450 and 700. (This answer is approximate, because
these 35% actually include the test-takers whose scores were exactly 450.
The table does not provide enough information to permit us to answer
this question precisely; despite that flaw, this phraseology is used on the CLAST).
EXAMPLE 2.8.14
The table below gives an accurate portrayal of the distribution of humans according to I.Q. score.
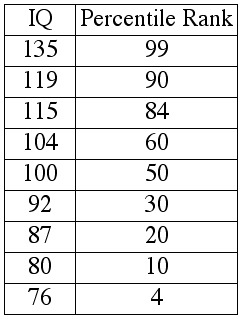 The image is a table conveying the following information :
An I.Q. score of 800 has a percentile rank of 99.
An I.Q. score of 135 has a percentile rank of 85.
An I.Q. score of 119 has a percentile rank of 90.
An I.Q. score of 115 has a percentile rank of 84.
An I.Q. score of 104 has a percentile rank of 60.
An I.Q. score of 100 has a percentile rank of 50.
An I.Q. score of 92 has a percentile rank of 30.
An I.Q. score of 87 has a percentile rank of 20.
An I.Q. score of 80 has a percentile rank of 10.
An I.Q. score of 76 has a percentile rank of 4.
1. What percent of humans have I.Q. scores greater than or equal to 119?
A. 90
B. 99
C. 9
D. 10
2. Approximately what percent of humans have I.Q. scores between 92 and 104?
A. 30
B. 50
C. 20
D. 10
3. What percent of humans have I.Q. scores less than 87?
A. 24
B. 20
C. 14
D. 10
SOLUTIONS
1. What percent of humans have I.Q. scores greater than or equal to 119?
Since a score of 119 has a percentile rank of 90, 90% of humans have I.Q. scores that are less than 119. This means that
the other 10% have I.Q. scores that are greater than or equal to 119.
2. Approximately what percent of humans have I.Q. scores between 92 and 104?
Since a score of 104 has a percentile rank of 60, 60% of humans have I.Q. scores that are less than 104.
Since a score of 92 has a percentile rank of 30, 30% of humans have I.Q. scores that are less than 92.
Thus, roughly 60% minus 30% equals 30% have scores between 104 and 92.
3. What percent of humans have I.Q. scores less than 87?
Since a score of 87 has a percentile rank of 20, 20% of humans have I.Q. scores that are less than 87.
What about "nth percentiles?"
Download practice exercises (PDF file)