EXAMPLE 2.9.7
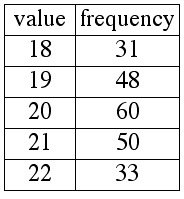
The frequency table below represents the distribution, according to age, of students in a certain class.
1. Find the mean, median, and mode for this distribution.
2. True or false: 18 students were 31 years old.
SOLUTIONS
2. We solve solve the second problem first. The statement "18 students were 31 years old" is false. The fact that the value 18 has a frequency of 31 means that 31 students were 18 years old.
1.
Mode
The mode is 20 years, because 20 is the value that has the greatest frequency.
Mean
First we must find n, the number of data points in the distribution. Recall that we find n by taking the sum of the frequencies:
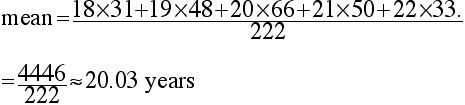
n = 31 + 48 + 60 + 50 + 33 = 222
There are 22 students.
The mean is the sum of all 222 data points, divided by 222:
Median
First we find the position of the middle of the distribution.
![]()
Since 111.5 is between 111 and 112, the "middle of the distribution" is between the 111th and 112th data points. This means that the median is the average of the 111th and 112th numbers on the ordered list. We can find the 111th and 112th numbers by examining cumulative frequency:
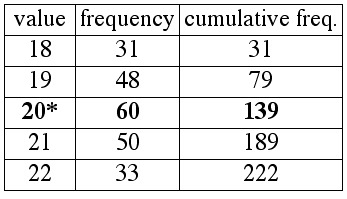
The column for cumulative frequency first exceeds 112 in the third row, where the value is 20. Thus the 111th and 112th numbers on the ordered list are both 20, so the median is 20.