EXAMPLE 3.1.6 SOLUTIONS
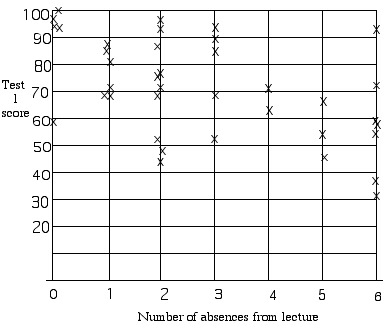
The scatter diagram below shows the relationship between the number of absences from lecture and the Unit 1 test score for students in one section of Liberal Arts Mathematics during spring semester, 1999. Determine whether each of the statements given below is true or false.

1. The students with the two lowest scores had the greatest number of absences. True
2. Increased numbers of absences are always associated with lower test scores. False
3. Among students with at least 4 absences, the highest test score was about 70. False
4. Students who had zero absences tended to do better than the other students. True
5. Skipping class causes students to get lower test scores. False
6. Among students with fewer than 2 absences, only one failed to get a test score of at least 60%. True