EXAMPLE 3.1.5
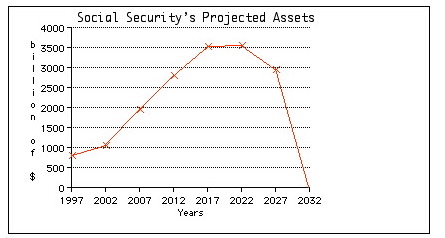
The graph below shows the projected assets of the Social Security Trust Fund over the period of time beginning in 1997 and ending in 2032. Based on these projections, decide whether each statement is true or false.
A. The assets will be non-negative over the entire period of time.
This is true, because the graph never falls below the horizontal line that denotes assets of $0.
B. The assets will be increasing over the entire period of time.
This is false; the assets will be increasing over any period of time where the graph rises as we look from left to right; the assets will be decreasing over any period of time where the graph is falling as we look from left to right. Thus, assets will be decreasing over the period that begins roughly in the year 2022.
C. Over the period of time from 2022 to 2027, the Social Security Trust Fund will be in debt.
This is false; in order for the system to be in debt, the assets would have to be negative (that is, the graph would have to fall below the horizontal line that denotes assets of $0).
D. Over the period from 2007 to 2032 the assets will decrease by about $2000 billion.
In 2007, the assets will be about $2000 billion. In 2032, the assets will be about $0; thus, over that period of time the assets will decrease by about $2000 billion. The statement is true.