EXAMPLE 3.2.8
Members of the
preview audience for the new Arnie Schvartzengagger film,
The
Predagagger XII: Things Blow Up,
were asked to rank the film from 0 ("stinks like a dead cyborg") to 6
("XII thumbs up!"). The results are summarized in the table below.
|
Value |
Frequency |
|
0 |
96 |
|
1 |
32 |
|
2 |
28 |
|
3 |
20 |
|
4 |
12 |
|
5 |
10 |
|
6 |
2 |
1. True or
false: The median is 3.
2. True or
false: The mean is 3.
3. True or
false: Twenty-eight people gave the film a rank of 2.
4. True or
false: 128 people gave the film a rank of less than 28.
SOLUTION
1. First we add frequencies to find n, the number of data
points in this distribution.
n = 96 + 32 + 28 + 20 + 12 + 10 + 2 = 200
The table
represents an ordered list of 200 numbers. To find the median, we use the fact that 201/2 indicates the
“middle position” in this list.
That is, the “middle of the list” is 100.5, or between the 100th
and 101st numbers. To
find the median we need to count frequencies until we find the 100th
and 101st numbers.
The first 96
numbers are all “0s” and the next 32 numbers are all “1s,’ so the 100th
and 101st numbers are both “1.” The median is 1, not 3.
The answer to
question #1 is “False.”
2. Now we find the mean:
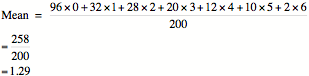
The answer to question
#2 is “False.”
3. True or
false: Twenty-eight people gave the film a rank of 2.
Since the value
“2” has a frequency of 28, this statement is true.
4. True or
false: 128 people gave the film a rank of less than 2.
True; 96 people gave the film
people gave the film a ranking of 1, and another 32 people gave the film a rank of 1, so 128 people gave the the film a rank of less than 2.