PROBABILITY
Classical or theoretical definitions:
Let S be the set of all equally likely outcomes to a random experiment.
(S is called the sample space for the experiment.)
Let E be some particular outcome or combination of outcomes to the experiment.
(E is called an event.)
The probability of E is denoted P(E).
![]()
![]()
EXAMPLE 3.3.1
Roll one die and observe the numerical result. Then S = {1, 2, 3, 4, 5, 6}.
Let E be the event that the die roll is a number greater than 4.
Then E = {5, 6}
So
![]()
EXAMPLE 3.3.2
Referring to the earlier example (from Unit 3 Module 3) concerning
the National Requirer:
What is the probability that a randomly selected story will be about Elvis?
see solution
EXAMPLE 3.3.3
An office employs seven women and five men.
One employee will be randomly selected to receive a free lunch with the boss.
What is the probability that the selected employee will be a woman?
see solution
EXAMPLE 3.3.4
An office employs seven women and five men.
Two employees will be randomly selected for drug screening.
What is the probability that both employees will be men?
see solution
EXAMPLE 3.3.5
Roll one die and observe the numerical result. Then S = {1, 2, 3, 4, 5, 6}.
Let E be the event that the die roll is a number greater than 4.
What about the probability that E doesn't occur?
We denote this as
![]()
Then
![]()
so
![]()
Note that
![]()
This relationship (the Complements Rule) will hold for any event E:
"The probability that an event doesn't occur is 1 minus the
probability that the event does occur."
EXAMPLE 3.3.6
Let F be the event that the die roll is a number less than 7.
Then F = {1, 2, 3, 4, 5, 6}
So
![]()
If an event is certain to occur, then its probability is 1.
Probabilities are never greater than 1.
EXAMPLE 3.3.7
Let G be the event that the die roll is "Elephant."
Then G = { }
So
![]()
If an event is impossible, then its probability is 0.
Probabilities are never less than 0.
We have the following scale:
For any event E in any experiment,
![]()
EXAMPLE 3.3.8
A jar contains a penny, a nickel, a dime, a quarter,
and a half-dollar. Two coins are randomly selected (without replacement) and their
monetary sum is determined.
1. What is the probability that their monetary
sum will be 55¢?
A. 1/25
B. 1/32
C. 1/9
D. 1/10
2. What is the probability that the monetary sum
will be 48¢?
A. 1/10
B. 1/9
C. 1/32
D. 0
see solution
EXAMPLE 3.3.9
What is the probability of winning the Florida
Lotto with one ticket?
see solution
Empirical or Statistical Probability
EXAMPLE 3.3.10
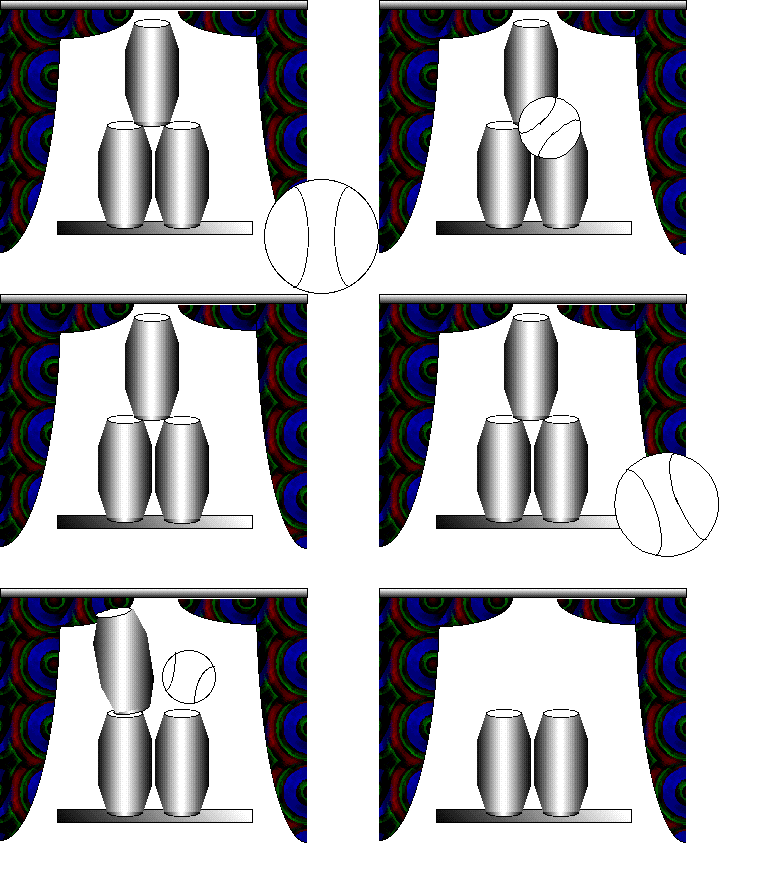
A carnival game requires the contestant to
throw a softball at a stack of three "bottles." If the pitched
softball knocks over all three bottles, the contestant wins.
We want to determine the probability that a randomly selected contestant will
win (event E). How can this be done?
Note that the classical definition of probability does not apply in this case,
because we can't break this experiment down into a set of equally likely outcomes.

For instance, one outcome of the experiment is the situation where no bottles are toppled.
Another outcome is the case where 1 bottle is topples, another is
the case where 2 bottles are topples, and yet another outcome is the case
where all 3 bottles are toppled. However, we don't know that these outcomes
are equally likely.
In cases where it is not possible or practical to analyze a probability
experiment by breaking it down into equally likely outcomes, we can estimate
probabilities by referring to accumulated results of repeated trials of the experiment.
Such estimated probabilities are called empirical probabilities:
Empirical Probability
![]()
![]()
In a similar way, we can refer to population
statistics to infer to probability of a characteristic distributed across a population.
The statistical probability of an event E is the proportion of the population
satisfying E.
EXAMPLE 3.3.11
For instance (this is authentic data), a recent (1999) study of bottled water,
conducted by the Natural Resources Defense Council, revealed that:
40% of bottled water samples were merely tap water.
30% of bottled water samples were contaminated by such pollutants as
arsenic and fecal bacteria.
Let E be the event "A randomly selected sample of bottled water
is actually tap water."
Let F be the event "A randomly selected sample of bottled water
is contaminated."
Then:
P(E) = 40% = .4
P(F) = 30% = .3
EXAMPLE 3.3.12
According to a recent article from the New England Journal of Medical Stuff ,
63% of cowboys suffer from saddle sores,
52% of cowboys suffer from bowed legs,
and 40% suffer from both saddle sores and bowed legs.
Let E be the event "A randomly selected cowboy has saddle sores."
Then P(E) = .63
Let F be the event "A randomly selected cowboy has bowed legs."
Then P(F) = .52
Likewise, P(cowboy has both conditions) = .4
ODDS
Odds are similar to probability, in that they involve a numerical
method for describing the likelihoood of an event.
Odds are defined differently however.
![]()
Odds are usually stated as a ratio.
EXAMPLE 3.3.13
Let E be the event that the result of a die roll is a number greater than 4.
Then "the odds in favor of E" = 2/4
Or "2 to 4"
or "2:4"
Download practice exercises (PDF file)