EXAMPLE 3.5.8
The table below shows the results of a survey of TV viewing habits:
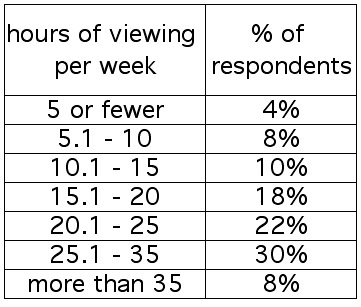
Assume that Homer and Gomer are a couple of randomly selected, independent guys.
According to the data in the table above, what is the probability that:
1. Homer views TV for 5 or fewer hours per week, and Gomer views TV for 10.1 - 20 hours per week?
2. Homer views TV for 35 or fewer hours per week, and so does Gomer?
Still assuming that Homer and Gomer are a couple of randomly selected, independent guys:
3. What is the probability that neither of them falls in the 15.1 - 20 hours per week category?
4. What is the probability that at least one of them views TV for 15.1 - 20 hours per week?
SOLUTIONS
1. Let E be the event Homer views TV for 5 or fewer hours per week; then P(E) = .04. Let F be the event Gomer views TV for 10.1 - 20 hours per week; then P(F) = .10. Thus,

2. Let E be the event Homer views TV for 35 or fewer hours per week; then P(E) = .92. Let F be the event Gomer views TV for 35 or fewer hours per week; then P(F) = .92. Thus,

3. Let E be the event Homer doesn't fall into the 15.1 - 20 hour category; then P(E) = .82. Let F be the event Gomer doesn't fall into the 15.1 - 20 hour category; then P(F) = .82. Thus,

4. P(at least one does) = 1 - P(both don't) = 1 - .6724 = .3276