|
|
Mathematical and Computer Modelling
|
An objective of this thesis was to develop a methodology which determines the shape of the cortical surface. In particular, this methodology was applied to the primary visual cortex. The result is a three dimensional model of the visual cortex which can be used to provide anatomical constraints in the dipole source localisation model.
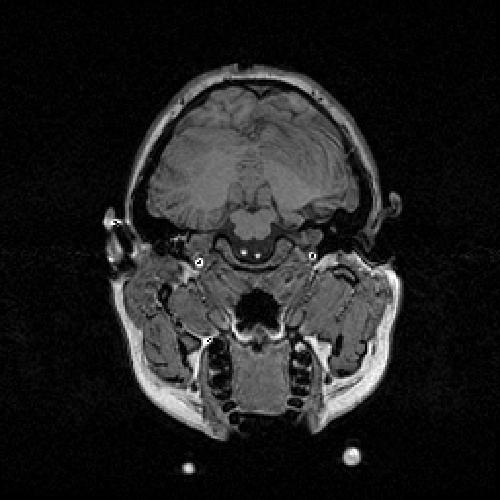
Anatomical information is required to model the visual cortex more realistically and magnetic resonance imaging (MRI) is well suited to this purpose. Cortical features were obtained from T1 weighted MR scans taken in a 1.5 Tesla field in order to maximise contrast between white matter and grey matter. Coronal scans of the entire head were taken 1.5 mm apart with contiguous spacings of 1.0 mm. A total of 118 slices, each 256x256 pixels, were obtained. Here is an example of a single MR slice.
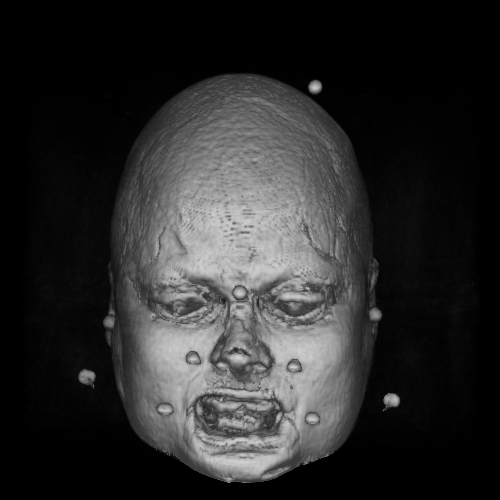
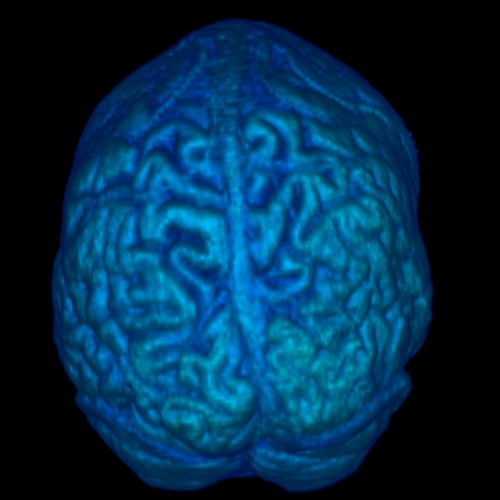
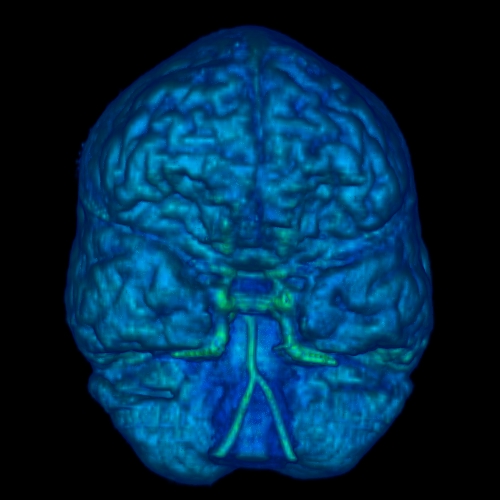
Three dimensional reconstructions of the scalp and neural tissue were created using the software AVS by stacking, transforming and rendering the MR data using ray tracing. Here are images of the reconstructed scalp and neural tissue.
 |
 |
 |
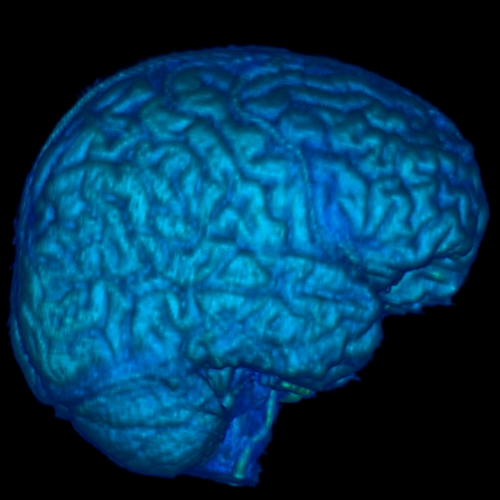 |
| Scalp | Posterior View of Neural Tissue | Anterior View of Neural Tissue | Lateral Right View of Neural Tissue |
Small blobs appearing in the MR slices and in the reconstructed scalp image are from fish-oil capsules which were used as markers to establish a transformation matrix for the MRI data and create a co-ordinate system.
Computer animations of the scalp and brain rotating were made using the software AVS. These were created using isosurfaces, rather than ray-tracings. Here is a movie of the scalp rotating (QuickTime format, 11.0Mb or AVI format, 0.7Mb) and a movie of the brain rotating (QuickTime format, 6.6Mb).
The aim was to model a particular region of cortex, and in particular, the visual cortex. A three dimensional reconstruction of the surface of the visual cortex surrounding the calcarine fissure was created. Twelve sagittal MR slices which contained the calcarine fissure in the right hemisphere of the brain were used. From each of these slices, the calcarine fissure and surrounding grey matter (region inside the white circle as shown in the following image) were extracted using the software Photoshop.
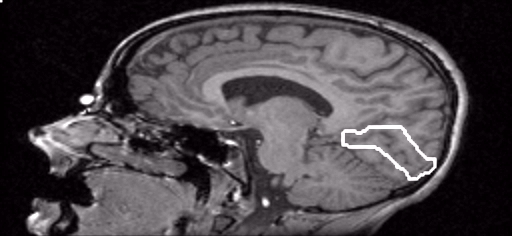
The stretched appearance of the above image is because the original MR scans were spaced vertically 1.5 mm apart, whereas in the other directions, they were spaced 1.0 mm apart. The image hasn't yet been transformed to adjust for these different spacings.
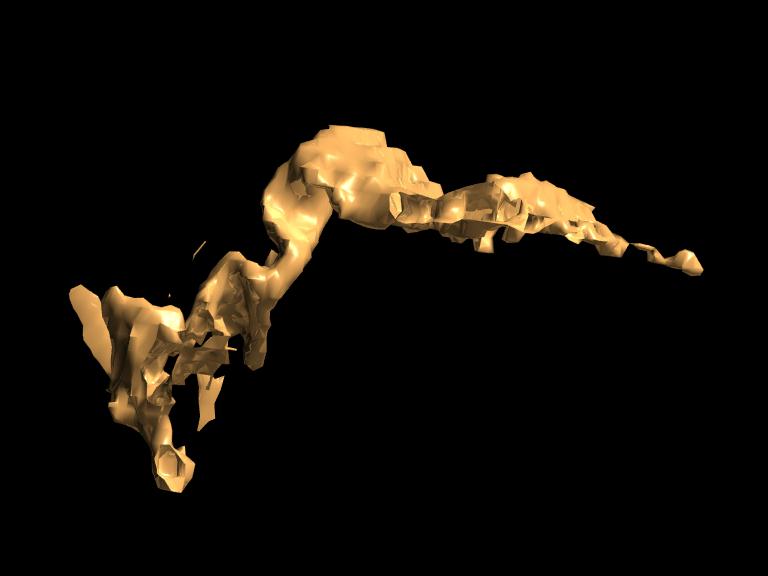
The extracted regions were imported back into the software AVS. A solid contour representation of the grey matter surface was obtained and an isosurface was used to approximate the the surface of the calcarine fissure and surrounding grey matter. The triangulated isosurfaces from AVS were then exported to the software Alias Wavefront for rendering and animation. The result is a three dimensional reconstruction of the surface representing the visual cortex. The posterior part of the head is on the left of the image.
A computer animation of the reconstructed calcarine fissure and surrounding grey matter rotating (QuickTime format, 1.5Mb), which represents the surface of the visual cortex, was made using Alias Wavefront PowerAnimator.
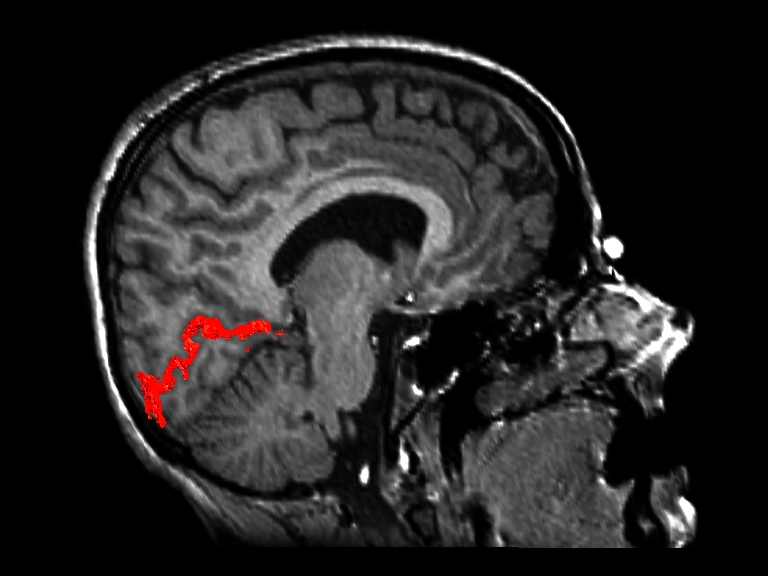
The following image indicates the location of the reconstructed surface (in red) in the brain.
A computer animation scrolls through sagittal MR images surrounding the reconstructed calcarine fissure and grey matter (QuickTime format, 2.8Mb).
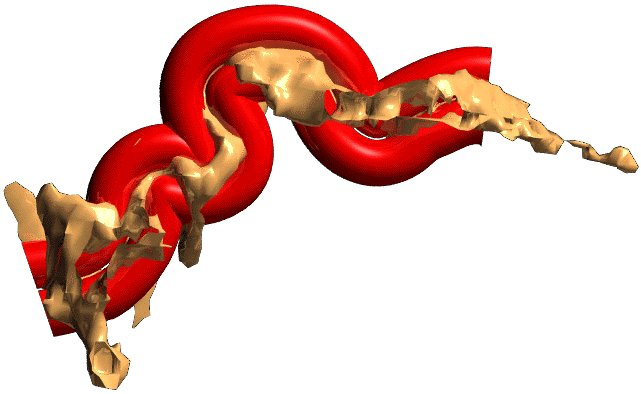
The surface of the visual cortex can be simplified by using cylinders to model the surface length. Alias Wavefront was used to create cylinders (shown in red on the following image) on either side of the calcarine fissure (yellow surface) to model the grey matter. PowerAnimator was then used to create a computer animation of the reconstructed calcarine fissure and grey matter with cylinders rotating (QuickTime format, 1.3Mb or AVI format, 0.4Mb).
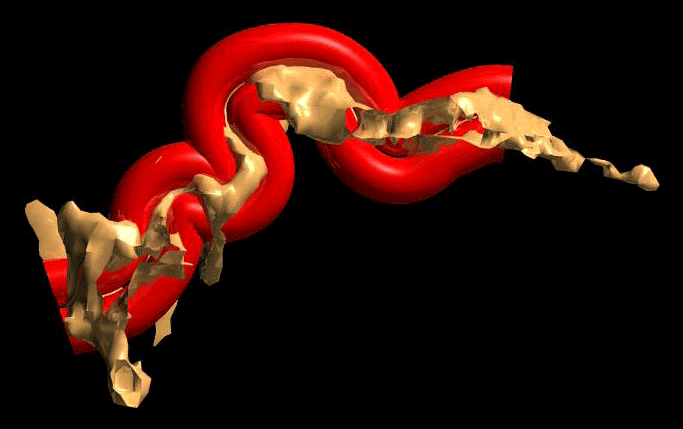
However, the cylinders are an over-simplification of the true shape of the calcarine fissure and visual cortex. The manner in which the calcarine fissure varies in height and width between adjacent MR slices can not easily be incorporated into this model. Just as the shape of the calcarine fissure varies along its length, its shape also varies considerably in its width and height. As a result, only the surface reconstruction of the calcarine fissure and surrounding grey matter was used as a model of the visual cortex. This model was used to obtain locations on the surface of the visual cortex and normals to the surface. This information can then be implemented to constrain a dipole position and orientation in the dipole source localisation model so only the dipole strength needs to be estimated.
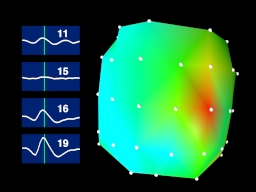
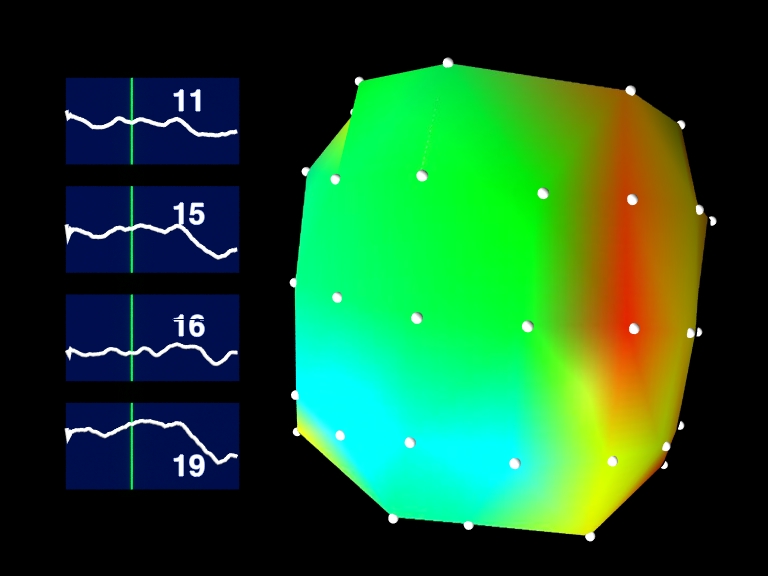
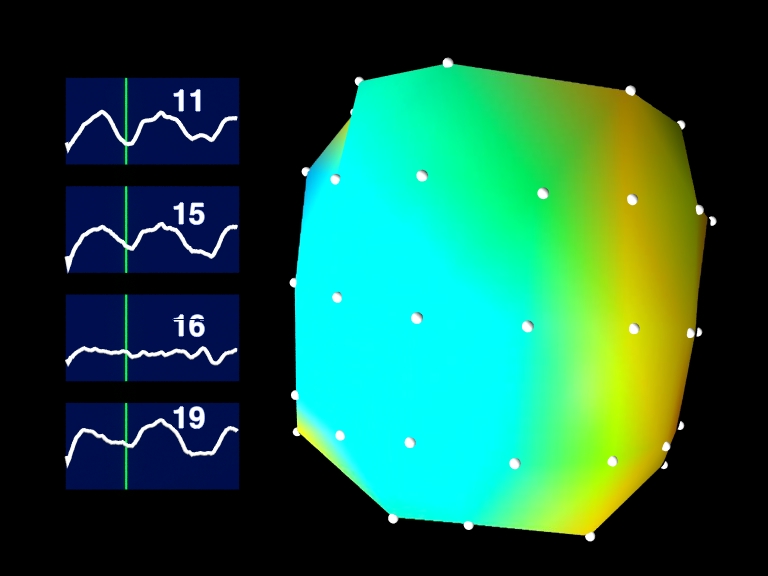
In order to investigate the visual cortex, experimental visual evoked potential (VEP) data were recorded and analysed using the models described in this thesis. Visual evoked responses were recorded when a red and green isoluminant chromatic grating stimulus was located at various eccentricities in the visual field. Data were recorded from 32 electrodes attached to the scalp in a polar array located over the posterior part of the head.
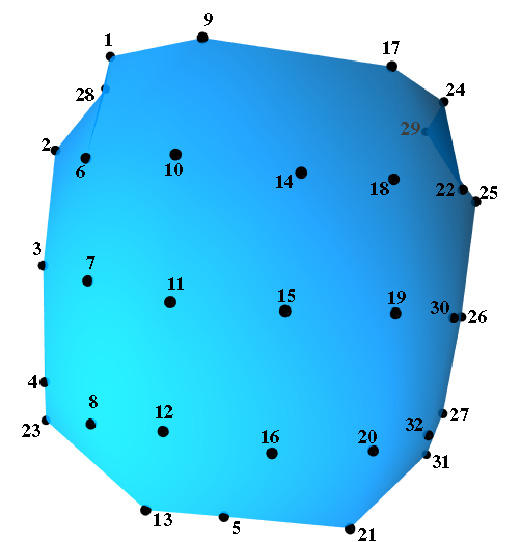
The black dots indicate the electrode positions. Each stimulus was presented for 1000 ms, of which the first 510 ms were recorded, sampled every 2 ms. Each stimulus was presented 200 times to produce an average response for each stimulus position. Topography maps of the observed potential distributions at a particular point in time were created with the software AVS by using Delaunay triangulation, and exported to Alias Wavefront PowerAnimator for rendering. The colours were also created by AVS and imported as a texture map into PowerAnimator.
Computer animations of the electrical
potential distribution changing over time were created by animating the
topography maps. The result shows the brain's activity over 250 ms flickering
over the posterior surface of the scalp. Graphs of the VEP waveforms recorded
at four of the
electrodes (electrodes 11, 15, 16, 19 from the above electrode array)
were also animated and added to the final composition
using Alias Wavefront Composer. Animations were created for three different
stimulus conditions in the lower left visual field along the vertical meridian:
Click on the links below each picture for computer animations of the potential activity changing over the first 250 ms of recorded brain activity. Three movies are provided for each of the three different stimulus conditions discussed above. The content of the three movies for each stimulus condition is identical, but differs in the movie format or the movie length. The different movies are provided as it may be easier to view one type of movie on some computer systems rather than the others.
Notice the peak (red flash) which occurs on the right side of topography maps. This is a nice result as the stimuli were located in the left visual field and the peak of activity would be expected to be in the right hemisphere of the brain.
Back to Movie Introductory Page
Click here for information on how to contact the author of this thesis, or how to obtain a copy of this thesis.