RELATIONSHIPS BETWEEN MEAN, MEDIAN and MODE in SPECIAL DISTRIBUTIONS
EXAMPLE 2.10.1
Refer to EXAMPLE 2.9.6.
Make a bar graph (using vertical bars) for the data in that example. On the horizontal axis, make note of the positions of the mean, median and mode.
EXAMPLE 2.10.1 SOLUTION
The bar graph looks like this:
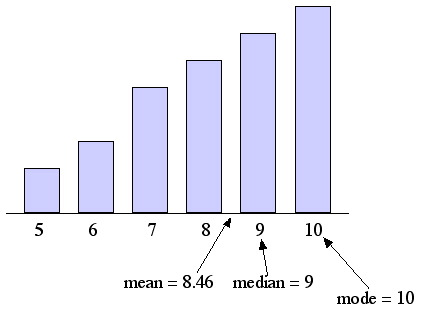
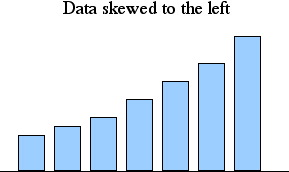
DATA SKEWED TO THE LEFT
The bar graph above is an illustration of a special kind of data distribution.
The distribution has the property that in every case, as the values increase the
frequencies increase as well. This means that on the bar graph, the columns get
taller as we look from left to right. In such a distribution, we say that the data
is skewed to the left.
In EXAMPLE 2.10.1 we saw that for a specific distribution that was
skewed to the left, the mode (10) was the greatest of the three measures of
central tendency, the mean (8.46) was the least of the three measures of central
tendency, and the median was in between. This illustrates a typical property of
data that is skewed to the left.
Typical property of data skewed to the left
Of the three measures of central tendency, the mode will be the greatest,
the mean will be the least, and the median will be in between.
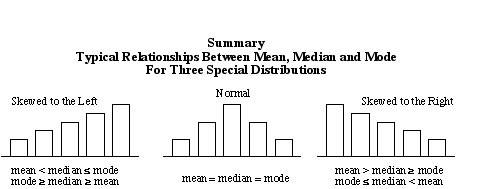
This relationship is summarized as follows:
mode > median > mean
which is the same as
mean < median < mode
(Note: there may be exceptions to this trend.)
EXAMPLE 2.10.2
Refer to the data in EXAMPLE 2.9.9. Make a bar graph that displays the data.
Use vertical bars. Additionally, note the relative positions of the mean, median
and mode on the horizontal axis.
EXAMPLE 2.10.2 SOLUTION
The bar graph looks like this:
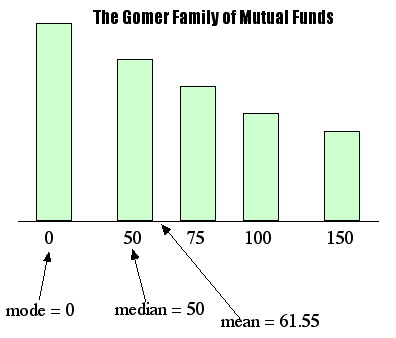
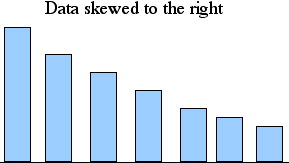
DATA SKEWED TO THE RIGHT
The data in the previous example had the following property:
in every case, increasing values are associated with decreasing frequencies.
This corresponds to the fact that on the bar graph, the bars get shorter as we
look from left to right. A distribution that has those properties is
called Skewed to the Right.
In EXAMPLE 2.10.2 we saw that for data skewed to the right, the
three measures of central tendency had this numerical relationship:
the mode (0) was the least, the mean (61.55) was the greatest, and the median was in
between. This illustrates the following typical property of
data skewed to the right:
Typical property of data skewed to the RIGHT
Of the three measures of central tendency, the mean will be the greatest,
the mode will be the least, and the median will be in between.
This relationship is summarized as follows:
mean > median > mode
which is the same as
mode < median < mean
(Note: there may be exceptions to this trend.)
EXAMPLE 2.10.3
The distribution of scores on an aptitude test is given below.
Find the mean, median and mode. Make a bar graph for the distribution,
using vertical bars. Show the relative positions of the three measures
of central tendency on the horizontal axis.
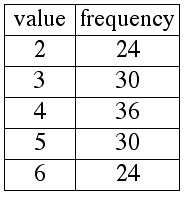
EXAMPLE 2.10.3 SOLUTION
Using the methods from Unit 2, Module 9 you will find that the mean, median and mode are all equal to 4. The bar graph looks like this:
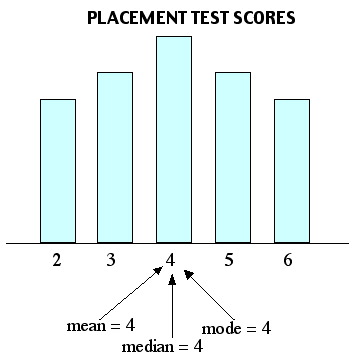
NORMALLY DISTRIBUTED DATA
In the previous example we saw a distribution whose bar graph was
symmetric, with the highest bar in the middle. This kind of distribution
is referred to as normal, or normally distributed data.
When graphed, normally distributed data will typically have an appearance similar to this:
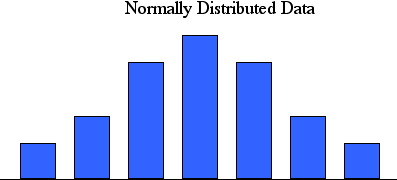
Typical property of NORMALLY DISTRIBUTED DATA
When data is normally distributed, the mean, median and mode will all be the same:
mean = median = mode
In each of the following examples, there is insufficient information
to compute exactly all three measures of central tendency ( especially the mean).
The problems can be solved by referring to the summary above.
EXAMPLE 2.10.4
The graph below shows the distribution according to height of a group of
jockeys at a south Florida horse track. Select the statement that correctly
describes a relationship between measures of central tendency for this distribution.
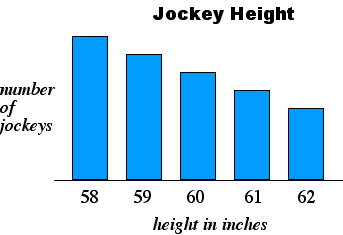
A. The mean is less than the mode.
B. The mode and the mean are the same.
C. The median is greater than the mode.
D. The median and the mean are the same.
see solution
EXAMPLE 2.10.5
The graph below shows the distribution of a group of Gator fans according the
number junk cars in their back yards. Select the statement that correctly gives a
relationship between measures of central tendency for this distribution.
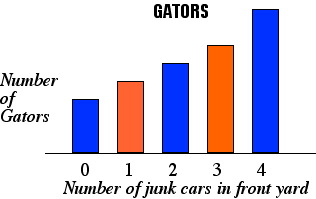
A. The mean is the same as the median.
B. The mean is less than the mode.
C. The mode is less than the mean.
D. The median is less than the mean.
see solution
EXAMPLE 2.10.6
Euclid is soliciting donations to fund his spring break trip to Cancun.
More than half of his donations have been in the amount of 50¢.
The others have been equally divided among values of 25¢ and values of 75¢.
Select the statement that correctly gives a relationship between measures of central
tendency for this distribution.
A. The median is greater than the mean.
B. The mean is less than the mode.
C. The mean is equal to the median.
D. The mode is less than then median.
see solution
EXAMPLE 2.10.7
Whenever Gomer goes for a stroll, he waves at every person who passes by.
He finds that the greatest number of people (nearly half of the people) do not wave back
(that is, they wave back with zero fingers). Of the others, most
wave back with one finger, while some wave back with five fingers.
Select the statement that is true regarding this distribution of fingers.
A. The mean is less than the mode.
B. The median is less than the mean.
C. The median is less than the mode.
D. The mean is the same as the median.
see solution
EXAMPLE 2.10.8
The graph below shows the distribution according to price of tickets sold for
Wrestlepalooza IV. Select the statement that correctly
describes a relationship between measures of central tendency.
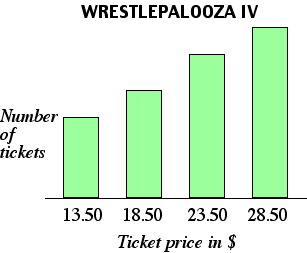
A. The mean is less than the mode.
B. The median is less than the mean.
C. The mode is the same as the mean.
D. The mean is the same as the median.
see solution
EXAMPLE 2.10.9
Gomer works as a waiter. The graph below shows the distribution of his tips last week.
Select the statement that correctly describes a relationship between measures of
central tendency for this distribution.
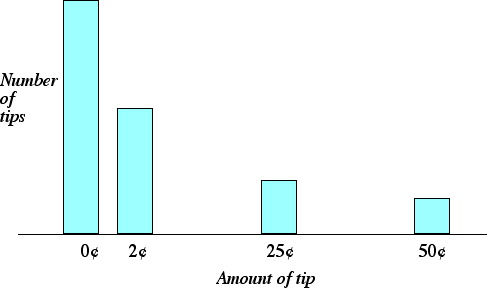
A. The median is greater than the mean.
B. The median is greater than the mode.
C. The mode is the same as the median.
D. The mean is less than the mode.
see solution
Download practice exercises (PDF file)